PaperVis: Literature Review Made Easy
Jia-kai Chou Chuan-Kai Yang
Computer Graphics & Multimedia Lab., NTUST
| Abstract |
Reviewing literatures for a certain research field is always important for academics. One could use Google-like
information seeking tools, but oftentimes he/she would end up obtaining too many possibly related papers, as well
as the papers in the associated citation network. During such a process, a user may easily get lost after following
a few links for searching or cross-referencing. It is also difficult for the user to identify relevant/important papers
from the resulting huge collection of papers. Our work, called PaperVis, endeavors to provide a user-friendly
interface to help users quickly grasp the intrinsic complex citation-reference structures among a specific group
of papers. We modify the existing Radial Space Filling (RSF) and Bullseye View techniques to arrange involved
papers as a node-link graph that better depicts the relationships among them while saving the screen space at
the same time. PaperVis applies visual cues to present node attributes and their transitions among interactions,
and it categorizes papers into semantically meaningful hierarchies to facilitate ensuing literature exploration. We
conduct experiments on the InfoVis 2004 Contest Dataset to demonstrate the effectiveness of PaperVis. |

|
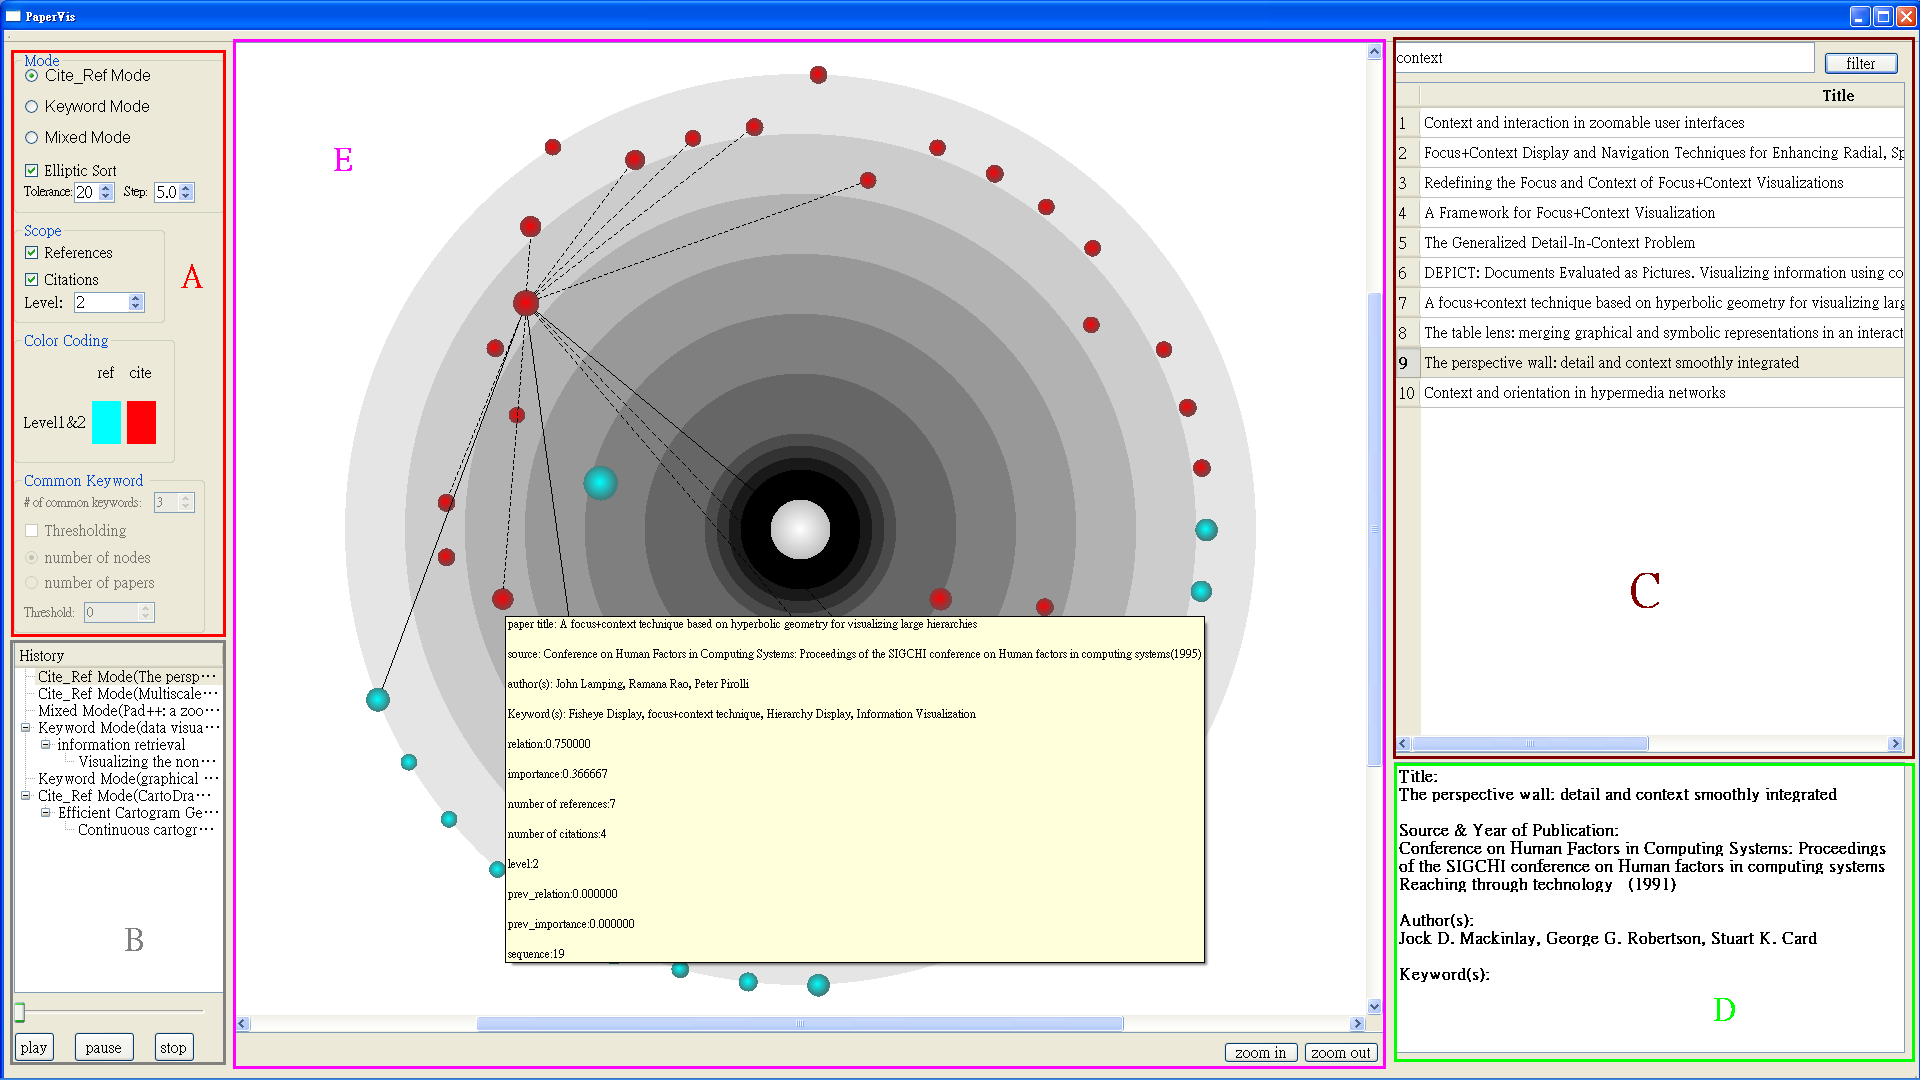
Figure 1: The user interface of PaperVis. The central area, region E, is for primary visualization. Region A contains the
configuration options, while region B is used for displaying the viewing history. Data filtering and selection controls are placed
in region C. Finally, details of the currently selected paper are shown in region D. |
|
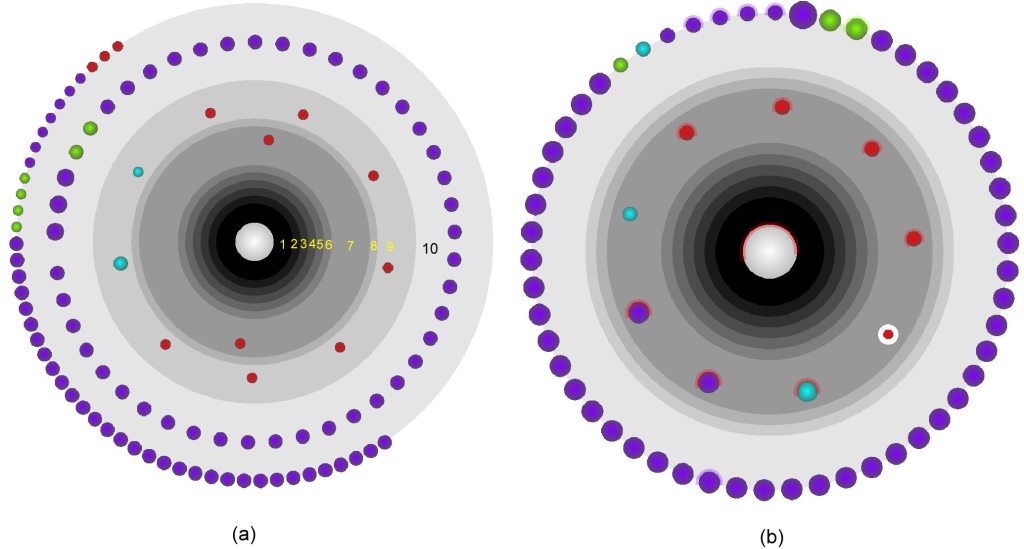
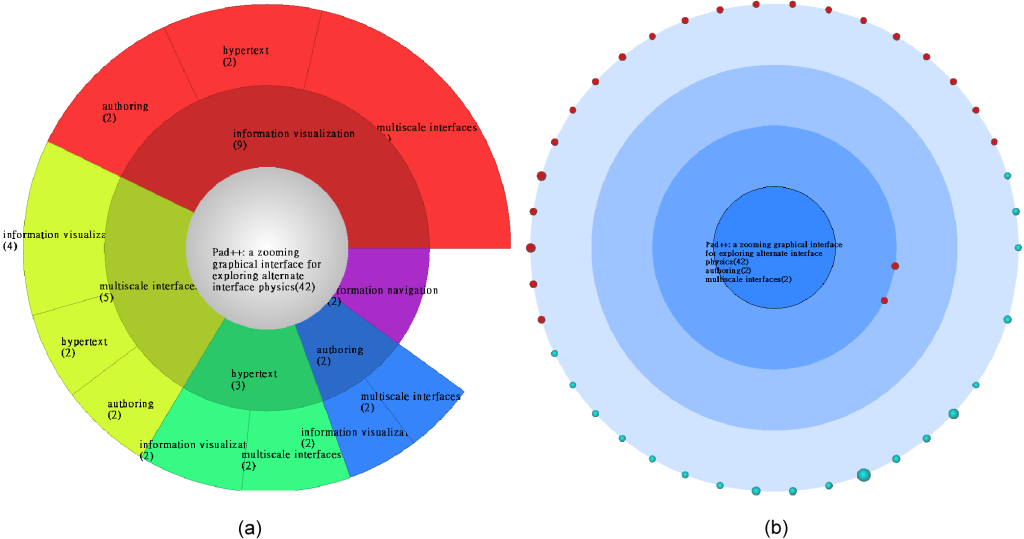
Figure 2: Examples of Citation-Reference Mode. (a) The
visualization result after a paper of interest being selected.
The bin circles, marked in yellow and black, are expanded
accordingly to accommodate the nodes in those bins. (b) In
a refocused view, colored boundaries of nodes show their
status in the previous view. |

|
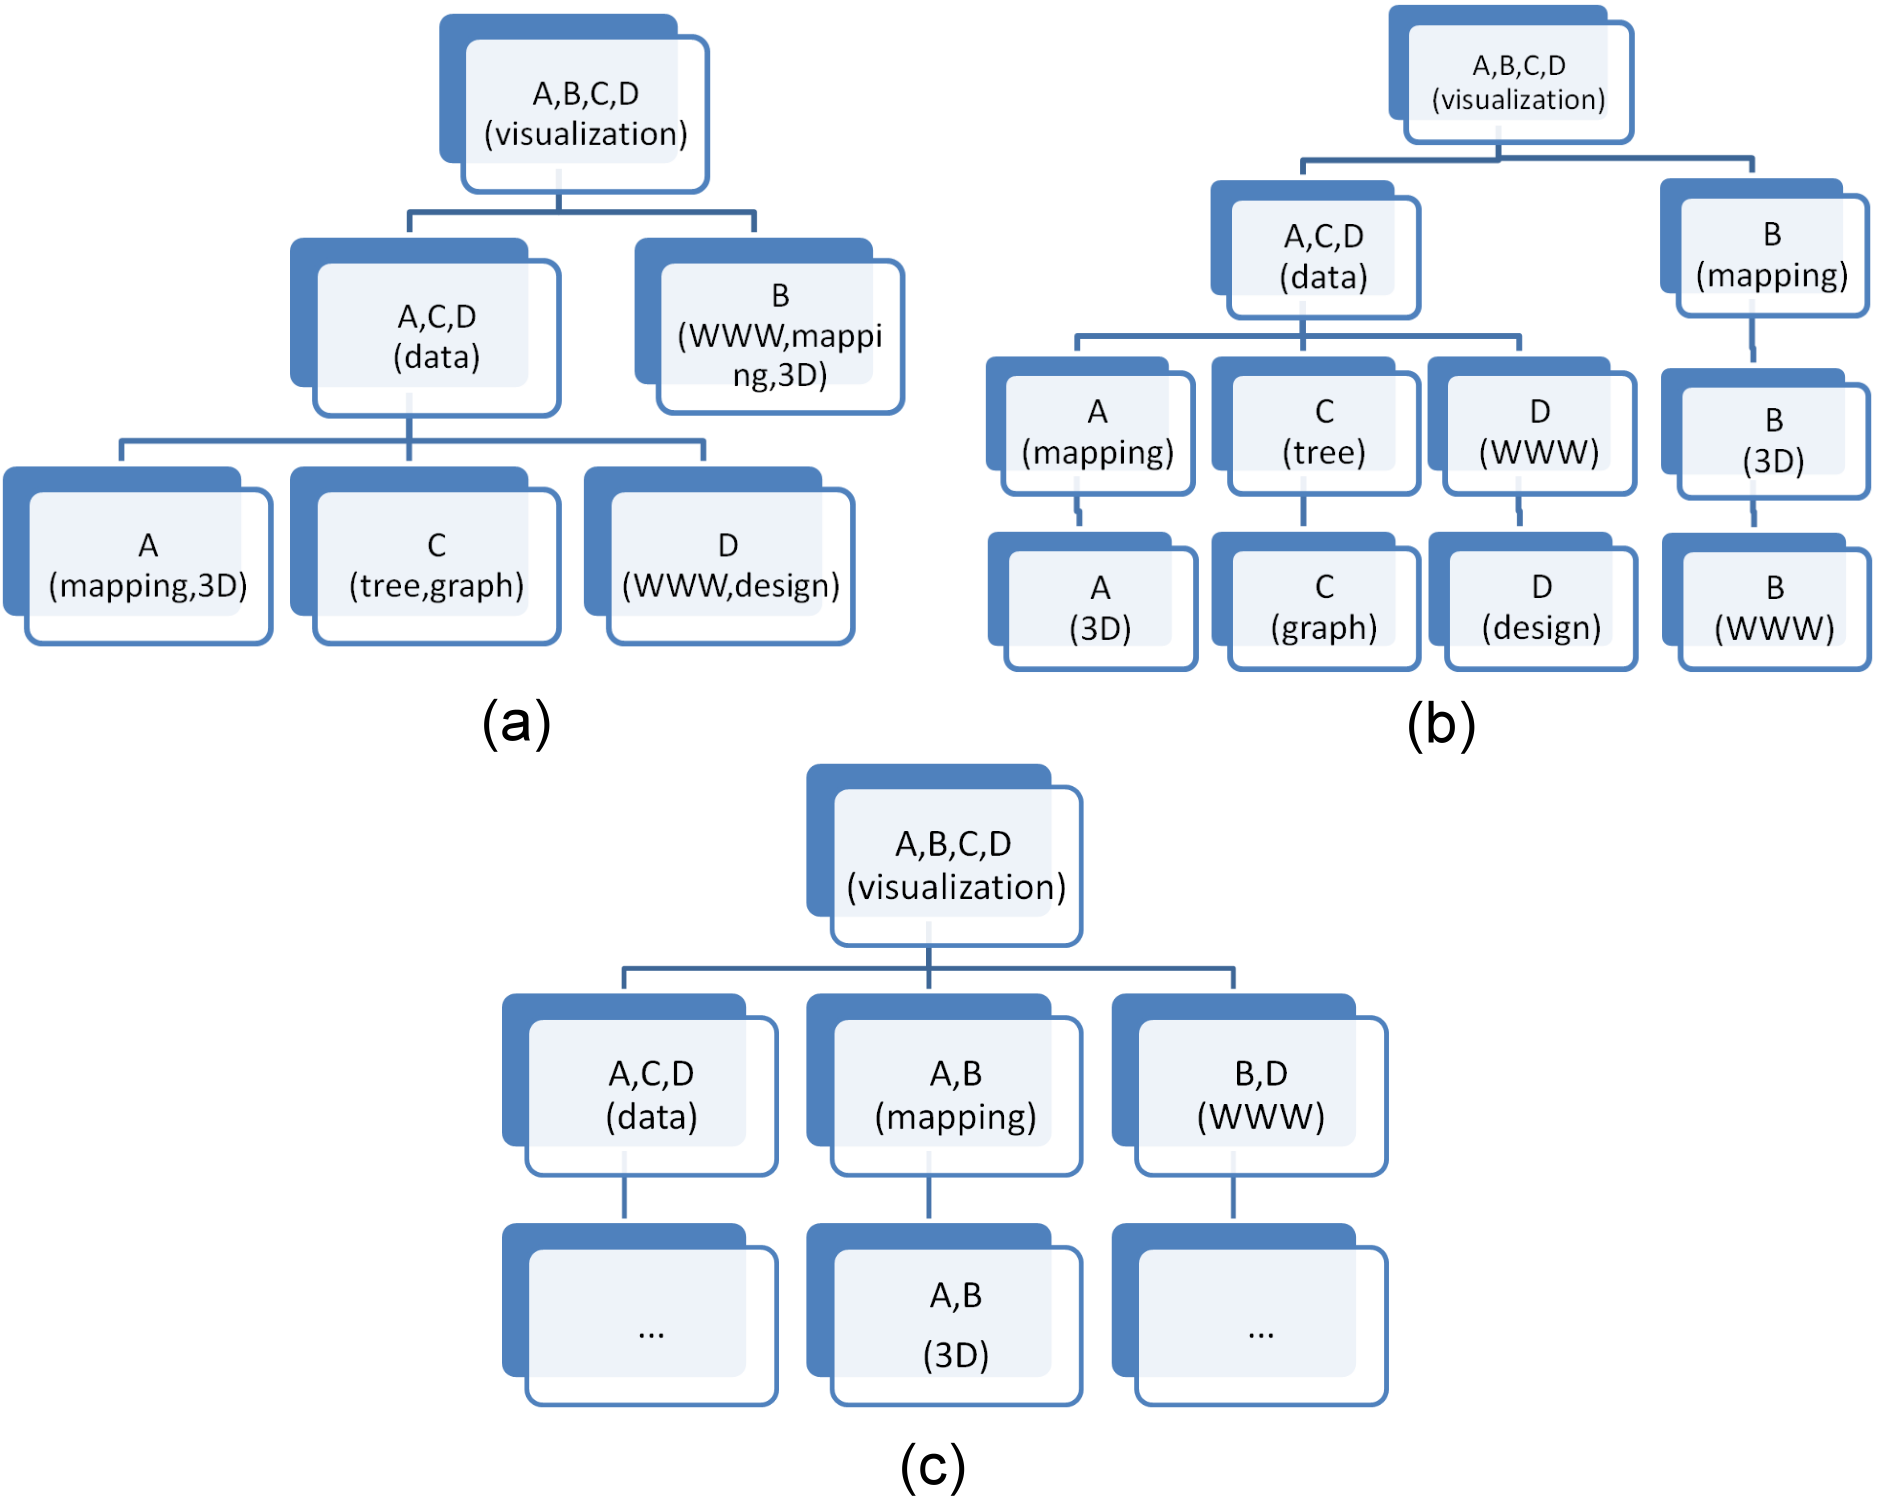
Figure 3: Results from (a) CaseCluster ,(b) FP-tree and (c)
PaperVis. Compared with CaseCluster and FP-tree, our proposed
algorithm keeps the largest common keyword sets between
2 papers. Paper A and paper B have 3 keywords in
common in this example. |

|
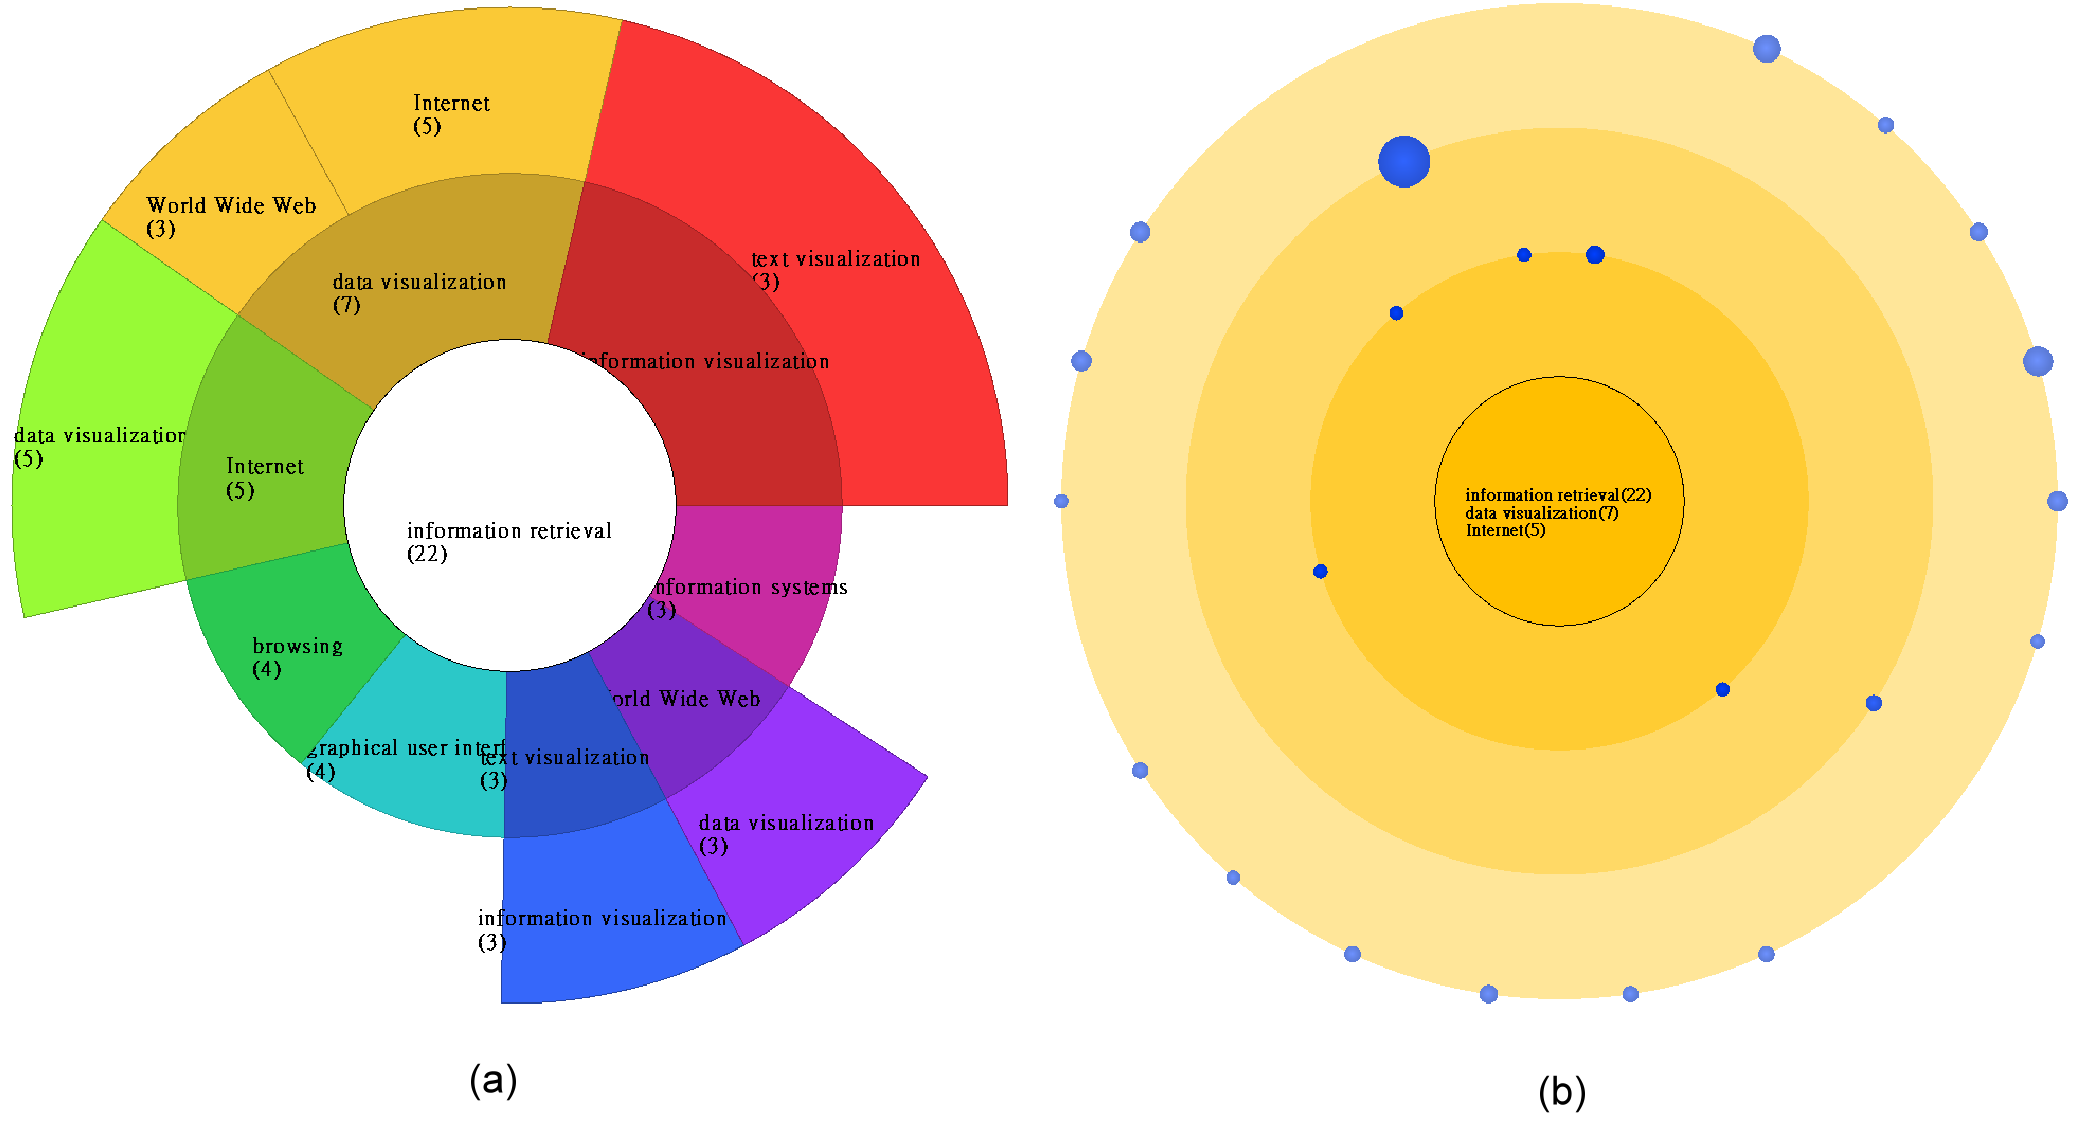
Figure 4: Examples in the Keyword Mode. (a) Start with
the papers containing the keyword information retrieval, and
find their common keyword sets with 3 keywords in common.
(b) The associate result after a node in (a) is double-clicked. |
|
Figure 5: Examples in the Mixed Mode. (a) Exploring papers
with 2 common keywords within a paper’s bibliographic
data. (b) The associate result after a node in (a) is doubleclicked.
The paper nodes in the outer circle refer to the papers
having no keywords in common with the center one. |
|
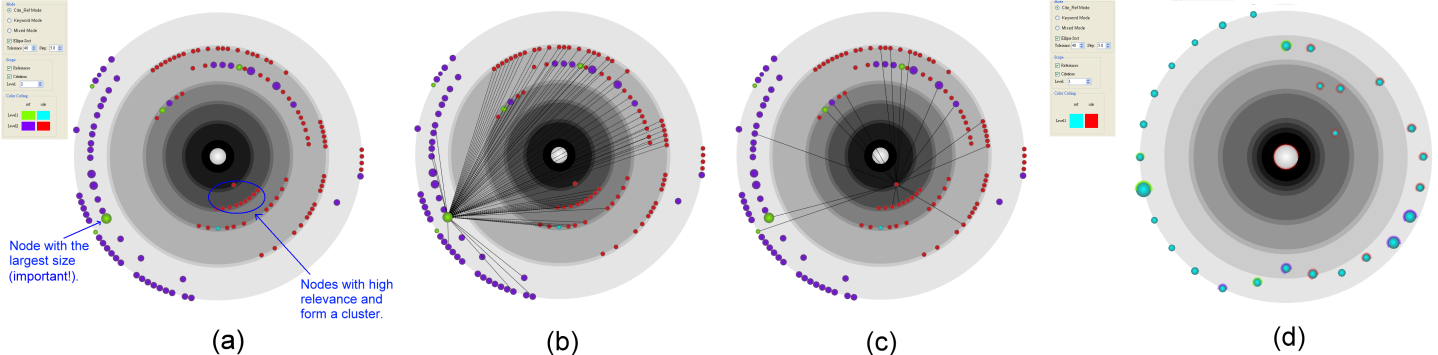
Figure 6: Results of Case Study 1. (a) The paper entitled Managing multiple focal levels in Table Lens is selected. And two
evident patterns could be easily observed. (b) Expanding the citation/reference relationships of the node with the largest size.
(c) Expanding the citation/reference relationships of the node which is the closest to the central node. (d) Refocusing on the
node selected in (c). And some interesting things can also be found by inspecting the nodes with colored boundaries. |
|
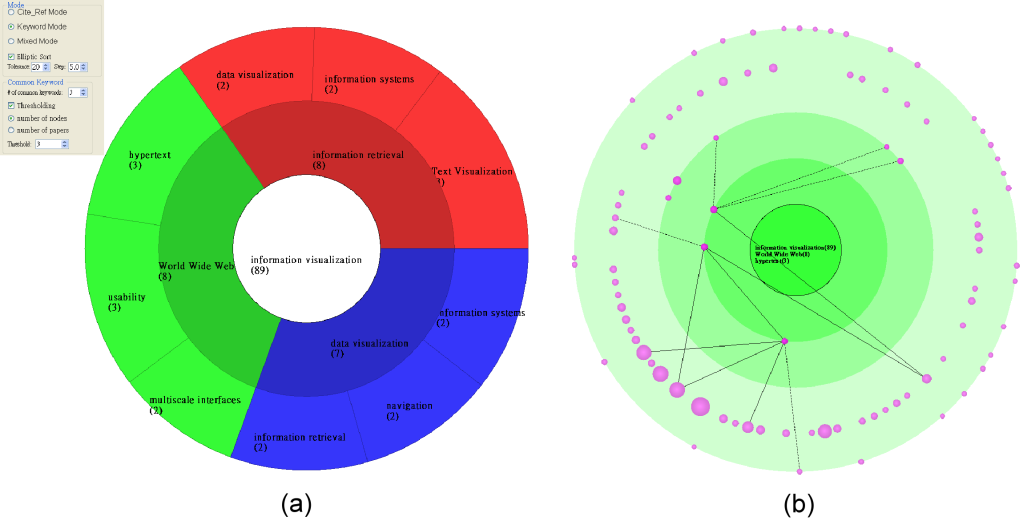
Figure 7: Results of Case Study 2. (a) The numbers of papers
contain the keyword information visualization and have
3 keywords in common are visualized. (b) The view is refocused
with the node hypertext(3) in (a). More information
could be dug out by expanding the citation/reference relationships
of the 3 nodes in the inner circle. |
|
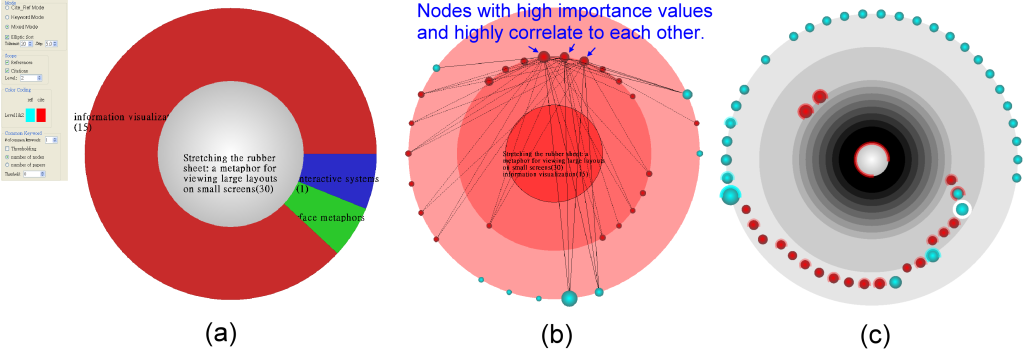
Figure 8: Results of Case Study 3. (a) There are 15 out
of the selected paper’s 30 references or citations share the
same keyword. (b) After refocusing the view, we found that
the papers with higher importance have bigger correlation
among each other. (c) Refocusing with the largest red node
in (b), and several patterns can be observed as well. |